MastersinDataScience.org is owned by 2U, LLC, parent company of edX. Our goal is to help learners make confident, informed decisions about their education and career. Some programs shown here are offered by universities that partner with 2U, for which 2U provides marketing and operational support and receives compensation. Other programs shown may be paid advertisements from third parties. Both types of programs are identified with the word AD or Advertisement. We aim to keep information current and accurate. Learn more about edX and our partners.
How to Learn D3: Tips and Tools
D3.js is the library behind many of the dynamic data visualizations on the web today. The highly customizable set of modules allows programmers to draw their data as they see fit, and then equip it with colors, animations and interactive elements.
With such a robust library and a steep learning curve, figuring out where to start with D3 can seem more complicated than the coding itself. The resources below will help you learn what D3 is, what you need to get started and what kind of tools are available.
- How Is D3 Used?
- What Do I Need to Know Before I Learn D3?
- Tips and Strategies to Learn D3
- Frequently Asked Questions
- Resources and Tools to Learn D3
How Is D3 Used?
D3.js (short for Data-Driven Documents) is a JavaScript library that combines HTML, SVG and CSS functionalities, allowing for low-level visualization abstraction.
Users can use D3 to bind data to a DOM (document object model), which represents the webpage in JavaScript. Then, the modules allow you to do things such as manipulate the data, draw SVG elements and use the provided visualization frameworks to implement scales and build specific chart layouts.
The potential is immense. The official D3 example gallery contains almost 200 chart types and just scratches the surface of what people are building. The data exploration and manipulation options are robust, too. Modules such as d3-array and d3-dsv allow for iterative manipulation and built-in parsing, respectively.
Accessing D3 is simple. Users can load the library with a single line of HTML code:
From there, applying D3’s built-in transformations and building a customized chart becomes more complicated. For example, a basic scatterplot requires users to grab and manipulate the data, build the appropriate axes and chart space and then draw and place the SVG elements onto the DOM.
D3 Chart and Code Snippet Example:
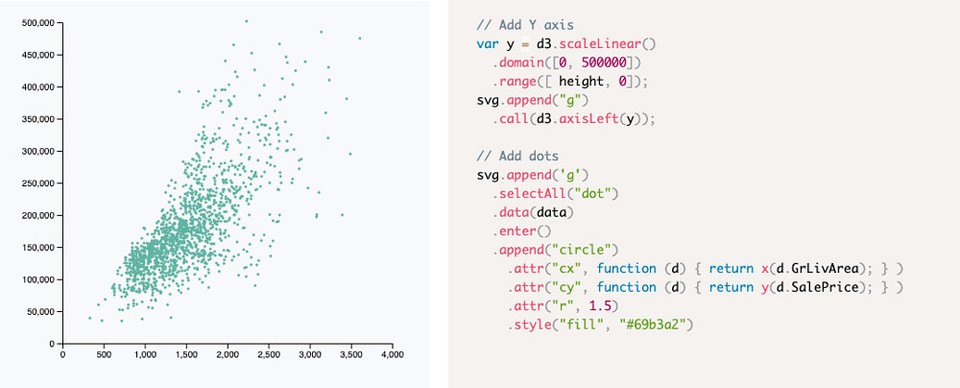
However, the intricacies are what help make D3 such a powerful tool. D3 creator Mike Bostock, cofounder of Observable and former New York Times graphic editor, describes the library as “unbounded.”
“You weren’t giving anything up by choosing D3 to do your visualizations. There wasn’t a risk that you wouldn’t be able to do something,” Bostock said in a 2021 interview about lessons after 10 years of D3.
Where other abstraction methods hit their limit, D3’s primary limit is each user’s knowledge. “It just gets kind of progressively harder, the more and more that you want to do with it.”
D3’s primary limit is each user’s knowledge.
Where Is D3 Used?
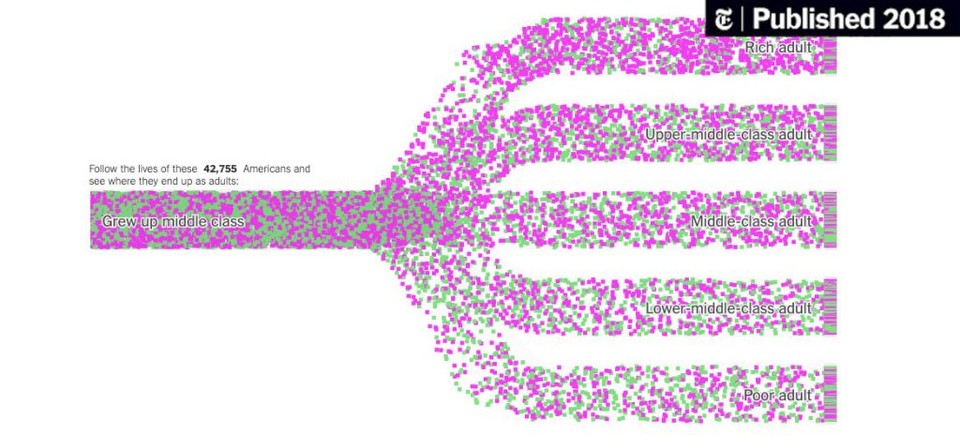
D3’s specificity and extensive library make it the tool of choice for many businesses, visualization practitioners and outlets. For example, “The Upshot,” the data visualization segment of The New York Times, relies on D3 to create interactive pages and charts.
A 2018 article on income mobility from “The Upshot” used D3 to display a series of animated Sankey charts, in which dots representing Americans start as part of a socioeconomic class and self-sort into an eventual outcome.
Other outlets with a heavy data visualization focus, such as The Pudding and Google News Lab, regularly use D3 to build charts, too.
It is also a popular choice for dashboards. Customized elements that can be updated externally and formatted to fit on a webpage are a natural use for D3.
What Do I Need to Know Before I Learn D3?
Before starting with D3, it may be helpful to have some experience with programming and design.
Foundations of programming:
D3 is a JavaScript library, but it also interacts with HTML and CSS elements. Therefore, it would be helpful to have some familiarity with the purpose and syntax of all three languages.
SVG (scalable vector graphics) provides the option to draw graphical elements. D3 allows you to select an SVG container and add attributes, styles and data marks. Then, HTML and CSS are used as placement and styling tools, respectively.
Web resources, tutorials and online coding bootcamps are available for those interested in gaining foundational programming knowledge. It is not necessary to be an expert in all of these areas, but a general familiarity with the purposes and syntaxes will make learning D3 easier.
Information design fundamentals:
Effective D3 visualizations must first be effective data visualizations. Individuals should have a grasp of the basic principles of information design, from defining the problem to understanding your audience and choosing marks and channels.
Some introductory books on information design and data visualization include:
- Visualization Analysis & Design by Tamara Munzner
- Storytelling with Data by Cole Nussbaumer Knaflic
- The Functional Art by Alberto Cairo
- The Visual Display of Quantitative Information by Edward Tufte
Tips and Strategies to Learn D3
D3 can seem overwhelming at first, but there are a lot of resources and strategies for those getting started. Consider the tips below as you begin learning the JavaScript library.
Start with D3 basics
The interactive possibilities, such as hover states and animations, are a large part of what makes D3 a desirable skill. However, beginners may have a difficult time with more complex functionalities without a strong understanding of the fundamentals such as axes, scales, binding data and manipulating SVGs and wrappers.
Avoid designing in code
Even though you will be building a visualization in D3, designing as you code will likely result in getting overwhelmed with the technicalities at the expense of your goal. The Pudding’s Ilia Blinderman recommends using simpler tools such as Keynote or Figma. Choose what you are most comfortable with, whether that is Adobe Illustrator, pen and paper or something in between.
Use existing code examples
D3 is open-source and prolific — there are hundreds of examples representing nearly every chart type or animation. Try experiments on existing notebooks, or try to replicate a D3 example from scratch to test your own skills. When building particularly complex charts, expert Nadieh Bremer recommends finding some code that lies close to your sketch and building on it from there.
Utilize accessor functions
Amelia Wattenberger, author of Fullstack D3 and Data Visualization, proposes “accessor functions” as a way to understand the data, access it later and save time. Save your metric to a variable (named something like xAccessor) that you can call back later in your code every time you need to access “x.” If the data structure changes, you only need to change xAccessor, instead of updating every single reference to “x” in your code.
Practice regularly
The key to mastering any new skill is repetition. With so many different chart types and modifications, plus an endless amount of data to visualize, there is no shortage of opportunities to practice D3. Weekly challenges such as “Workout Wednesday” and “Makeover Monday” offer visualization problems and a community to gain feedback from.
Frequently Asked Questions
Some aspects of D3, such as its difficulty and whether it is worthwhile, are hard to gauge from the start. Consult the frequently asked questions below to learn more.
Is D3 difficult to learn?
D3 is a very large set of modules with high customizability, so it can seem overwhelming to learn. The difficulty likely depends on an individual’s experience with JavaScript, HTML and basic web development. It can be a steep learning curve for new programmers because there may be a lot of new concepts.
How long does it take to learn D3?
If you understand the basic coding foundation, you can potentially build your first chart within a few hours. However, gaining a deep understanding of what each element is doing and how the manipulations work will take time. The amount of time you spend furthering your knowledge of D3 depends on how much you want to learn. How advanced do you want your visualizations to be? Do you want to experiment? What kind of interactions and animations will you try?
Is it worth it to learn D3?
Figuring out the best programming language to learn depends on your goals, experience and time. D3 is the library of choice for those who want to create highly customizable, interactive and dynamic visualizations for the web. For that reason, it can be a great tool to learn. However, it may not be ideal for simple, highly structured charts that can remain static. Other visualization libraries that could be helpful for higher level abstraction include ggplot, VegaLite or software such as Tableau.
Resources and Tools to Learn D3
Books and Tutorials
Learn D3: Introduction on Observable
Mike Bostock’s introduction to D3 is hosted in Observable, an online, interactive coding environment built for visualizations. This series of notebooks covers the basics of D3, from loading data and making scales, to animation and interactions.
Interactive Data Visualization for the Web, 2nd Ed. by Scott Murray
Murray’s book and the accompanying tutorials include downloadable D3 code and thorough instructions for building charts and adding interactivity. O’Reilly books are free for subscribers and may be available to students through their school library.
Fullstack D3 and Data Visualization by Amelia Wattenberger
Wattenberger’s book and master class include downloadable code and will have readers building a D3 line graph by the end of the first chapter. Fullstack D3 is available for purchase through Newline. Wattenberger’s blog also includes a library of D3 explainers and is free.
Peter Cook’s set of free tutorials aims to “bridge the gap between introductory tutorials/books and the official documentation.” It assumes knowledge of HTML, CSS and SVG elements.
Introduction to D3 course, Codecademy
This nine-lesson program includes a portfolio project and quiz at the end to test your knowledge. The course is available to Codecademy Pro subscribers.
Code Examples and Expert Work
The D3 documentation and API explains every module available, the various methods and includes code examples.
D3 Team notebooks on Observable
This set of code notebooks from the D3 authors allows users to make branches and build out their own versions.
The Pudding’s Russell Goldenberg records his process and the coding for some of his visual articles. They are free and Patreon subscribers get extra access to other process documentation.
Data Sketches by Nadieh Bremer and Shirley Wu
Bremer and Wu’s yearlong data visualization project is available as a book, and details a monthly project from each of them, complete with code snippets, original sketches and their thought process. Their initial blog for the project is free online.
Yan Holtz provides hundreds of simple D3 chart examples and accompanying downloadable code. You can also edit the code on the live site to make changes to his existing examples.
Community Help
The official D3 Slack community is free and open to anyone. It includes channels dedicated to code help, learning materials and events.
StackOverflow can be a great resource to get specific coding help; there are more than 30,000 questions tagged for D3 help.