MastersinDataScience.org is owned by 2U, LLC, parent company of edX. Our goal is to help learners make confident, informed decisions about their education and career. Some programs shown here are offered by universities that partner with 2U, for which 2U provides marketing and operational support and receives compensation. Other programs shown may be paid advertisements from third parties. Both types of programs are identified with the word AD or Advertisement. We aim to keep information current and accurate. Learn more about edX and our partners.
What Is Exploratory Data Analysis?
Many data scientists will agree that it is very easy to get lost in data—the more you collect, study and analyze, the more you want to explore. Rabbit holes of information are familiar and friendly places for data analysts and data scientists to dive into and spend hours extracting, modeling and analyzing these large datasets.
Data is collected and housed in some sort of data repository. It could be as simple as a spreadsheet or as complex as a database that comprises multiple spreadsheets or datasets. Generally, the rows in a database are individual records while the columns are the various characteristics of each record. But the human eye (and brain) can only scan so much data to analyze and learn from it. Exploratory data analysis allows analysts, scientists and business leaders to use visual tools to learn from the data.
What Is Exploratory Data Analysis? EDA Definition
Simply defined, exploratory data analysis (EDA for short) is what data analysts do with large sets of data, looking for patterns and summarizing the dataset’s main characteristics beyond what they learn from modeling and hypothesis testing. EDA is a philosophy that allows data analysts to approach a database without assumptions. When a data analyst employs EDA, it’s like they’re asking the data to tell them what they don’t know.
The National Institute of Standards and Technology (NIST) describes EDA as an approach to data analysis, not a model, that uses these techniques:
- Maximize insights into a dataset.
- Uncover underlying structures.
- Extract important variables.
- Detect outliers and anomalies.
- Test underlying assumptions.
- Develop parsimonious models.
- Determine optimal factor settings.
NIST explains that EDA is an approach to data analysis that “postpones the usual assumptions about what kind of model the data [follows]” and allows the data to reveal its underlying structure and model.
EDA is typically used for these four goals:
- Exploring a single variable and looking at trends over time.
- Checking data for errors.
- Checking assumptions.
- Looking at relationships between variables.
SPONSORED SCHOOL
Online BSc Data Science and Business Analytics
The online BSc Data Science and Business Analytics from the University of London, with academic direction from LSE, enables students to build essential technical and critical thinking skills and prepare for careers in data science, analytics and other growing fields – while they work, without relocating.
- Flexible pacing: Complete in as few as three years or as many as six.
- Designed for a range of ages and experience levels: This programme welcomes students of various ages and experience levels, including new students, transfer students and experienced professionals.

Example of Exploratory Data Analysis
It is not unusual for a data scientist to employ EDA before any other data analysis or modeling. It is often a step in data analysis that lets data scientists look at a dataset to identify trends, outliers, patterns and errors.
Example 1: EDA in retail
In a retail setting, business intelligence applications and experts look at data to measure sales in terms of how many units were sold, how much customers spent, what buyers also bought and seasonality of sales; then, they compare sales month over month, quarter over quarter and year over year. There are a lot more data points that retailers look at, of course, but a data analyst is generally looking to answer specific questions: How many units were sold? Over what time period? For how much? What are the demographics of our customers? And so on.
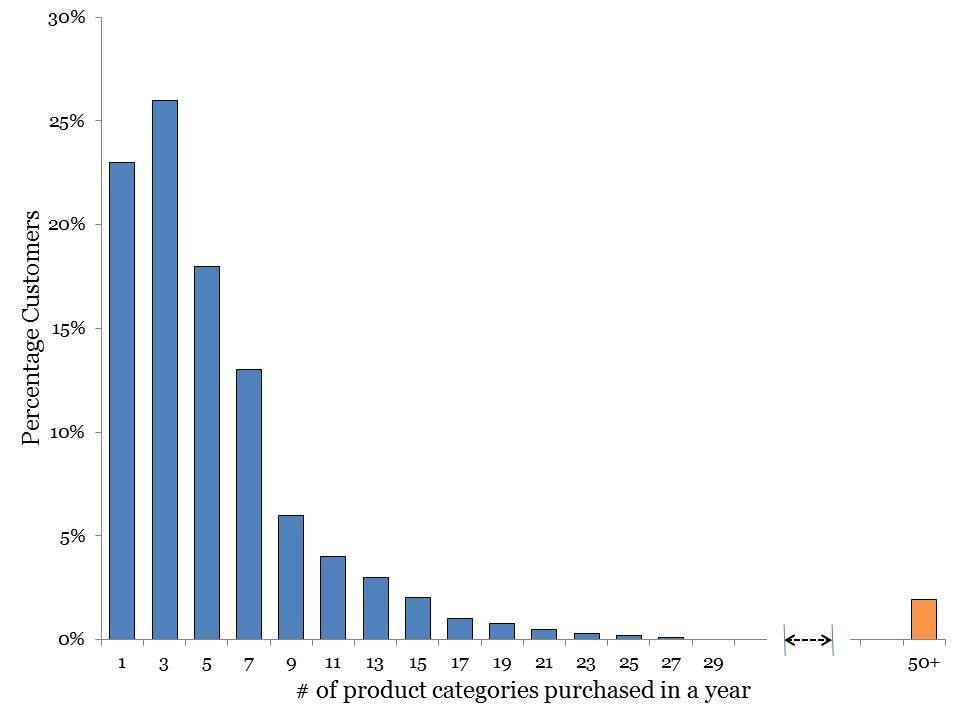
An EDA approach asks different questions. For example, what trends did we see in the last year in units sold? In this retail case study example from You CANalytics, an analyst would look at this graphic and note an interesting finding in the number of product categories purchased in one year. The number of categories declined, as expected, but then it spiked at 50-plus. Why? Further investigation revealed that other retailers were buying from them and reselling their goods. This could allow the retailer to develop a business-to-business sales strategy and build relationships with these smaller retailers.
Example 2: EDA in health care research
In a study published in PLoS ONE on exploratory data analysis of a clinical study group, researchers used EDA to verify the homogeneity of their patient population and identify outliers, but they also used it to help them identify subpopulations).
The patients in the study were identified by 40 attributes, including sex. The female groups were verified to be more homogenous than the male set, which researchers segmented into five subgroups. The researchers recommended separate testing for the five male subgroups, in order to avoid leading to false conclusions for the clinical trials.
Example 3: EDA in electronic medical records
Hospitals, health departments and health care networks contain vast amounts of data collected from electronic medical records (EMR) that non–data experts don’t know what to do with. These EMRs are subject to intense compliance regulations in order to protect patients’ privacy. However, health care organizations are looking for ways to leverage the data without tying it to individuals.
In a study published by Journal of Medical Internet Research, a group of researchers built a visual data mining system and tested it on the EMR of more than 14,000 patients who suffer from chronic kidney disease (CKD). The researchers took 13 years’ worth of information to build visualizations of CKD progression over time, as well as the presence of other medical conditions that are present in CKD patients at the same time, which may affect their outcomes.
Techniques and Tools
EDA methods typically fall into graphical or non-graphical methods and univariate or multivariate methods. It relies heavily on visuals, which analysts use to look for patterns, outliers, trends and unexpected results.
Graphical vs. non-graphical EDA
Graphical exploratory data analysis employs visual tools to display data, such as:
- Box plots: used to graphically depict data through their quartiles at five data points—lowest, first, median, third and maximum values; also sometimes called a whisker plot. Analysts use it to look at large sets of data. An example of this in practice is a utility that tracks water usage on a monthly basis.
- Heatmap: data visualization that uses colors to compare and contrast numbers in a set of data; also known as shading matrices. An example of this in practice would be traffic analyses, which look at heavy traffic patterns by time of day, day of the week and season.
- Histograms: bar chart that groups numbers together in a series of intervals, especially when there is an infinite variable, such as weights and measures. For example, it can be used to measure agricultural growth where units would be grouped in height ranges (100–150 cm vs. 100, 101, 102, etc.).
- Line graphs: one of the most basic types of charts that plots data points on a graph; has a wealth of uses in almost every field of study.
- Pictograms: replace numbers with images to visually explain data. They’re common in the design of infographics, as well as visuals that data scientists can use to explain complex findings to non-data-scientist professionals and the public.
- Scattergrams or scatterplots: typically used to display two variables in a set of data and then look for correlations among the data. For example, scientists might use it to evaluate the presence of two particular chemicals or gases in marine life in an effort to look for a relationship between the two variables.
Non-graphical exploratory data analysis involves data collection and reporting in nonvisual or non-pictorial formats.