Using Data to Determine Baseball’s Most Disappointing Teams
Disappointment is hard to quantify and compare. Expectations build, and then aren’t met. And the greater the expectations, the bigger the disappointment if failure arrives. At the end of the 2019 season, Major League Baseball crowned the Washington Nationals its best team. Few baseball fans believed the team would end the season on top of …
Applied Data Science
May 29, 2020-6 MIN READ
MastersinDataScience.org is owned by 2U, LLC, parent company of edX. Our goal is to help learners make confident, informed decisions about their education and career. Some programs shown here are offered by universities that partner with 2U, for which 2U provides marketing and operational support and receives compensation. Other programs shown may be paid advertisements from third parties. Both types of programs are identified with the word AD or Advertisement. We aim to keep information current and accurate. Learn more about edX and our partners.
Disappointment is hard to quantify and compare. Expectations build, and then aren’t met. And the greater the expectations, the bigger the disappointment if failure arrives.
At the end of the 2019 season, Major League Baseball crowned the Washington Nationals its best team. Few baseball fans believed the team would end the season on top of the baseball world – some called the National’s victory the biggest surprise in World Series history.
Only a few weeks earlier, the Nationals and their World Series opponents, the Houston Astros, faced very different paths. As of Sept. 23, data journalism website FiveThirtyEight gave Washington a 5% chance of winning it all. The Astros’ odds hadn’t dropped below 25% since August.
Nationals fans were historic underdogs, but the Astros’ base felt the flip side of that surprise: disappointment. They weren’t alone. The Cleveland Indians went from projected division winners to missing the playoffs entirely. The Detroit Tigers ended the season almost 70 games under .500.
America’s favorite pastime proves that no team is a guaranteed lock, and no season a stress-free success. Let’s analyze some seasons that fans would probably rather forget. How can we use data to find the most disappointing teams and seasons in baseball?
Examining MLB Projections: The Regular Season
Over the past decade, fans and analysts alike have been able to use data in almost every MLB interaction. Models run thousands of simulated seasons to predict champions and every hitter’s performance before the season even starts.
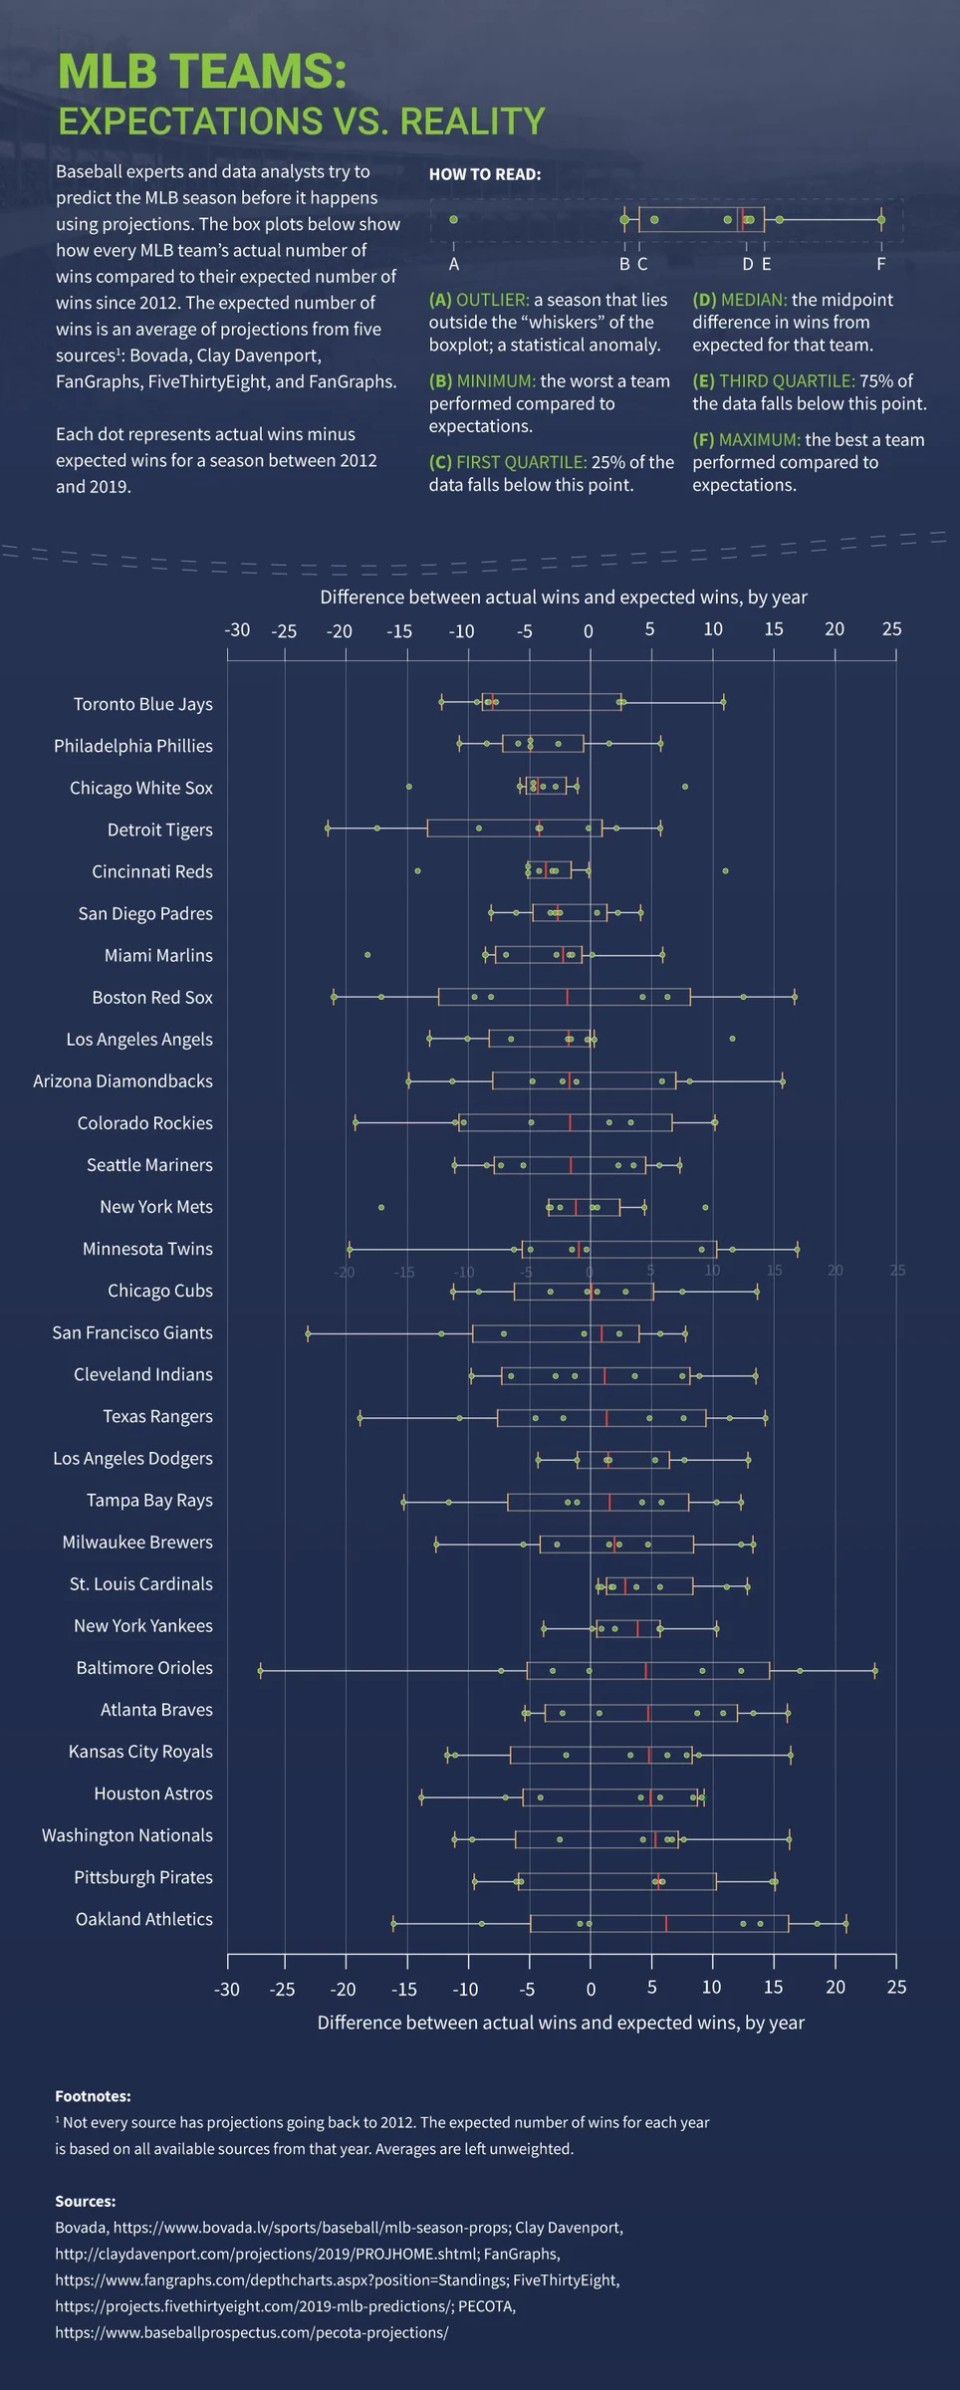
To test this question, we gathered preseason win projection data from five sources: FiveThirtyEight,Clay Davenport,PECOTA,FanGraphs, and Bovada’s Vegas odds for every year available since 2012. Then, we found the average number of expected wins for each team, each season, based on those projections.
With the expectation set, the next step is to compare reality. The number of games a team actually wins in a season minus the number of expected wins will tell us whether they performed better or worse than projected.
For example, at the start of the 2019 season, the average number of predicted wins for the Texas Rangers was 70.4 games. They won 78 games, giving them a win difference of +7.6 games.
Over time, the data can show which teams are more or less likely to disappoint.
Key takeaways from our findings:
Overall, the average difference between actual and predicted wins is close to zero (-0.1). That means that, generally, these projections are accurate, but the variation from season to season and team to team shows they aren’t exact.
The Oakland Athletics fare the best compared to expectations, winning about six games more than predicted on average. And when they do better than projected, they do a lot better. Every time they exceeded expectations it was by more than 12 games.
The Baltimore Orioles have both the largest positive and negative win differences from expectations. In 2012, they won 23.3 more games than predicted and would go on to make the playoffs for the first since 1997. In 2018, the Orioles won only 45 games – 27 fewer than predicted and their lowest win total since 1939.
The Toronto Blue Jays tend to underperform the most, winning an average of eight fewer games than projected.
The St. Louis Cardinals are the only team that has never won fewer games than projected. The closest they came was in 2014, when they were expected to win 89.4 games and won 90.
The Chicago White Sox and the Cincinnati Reds are most likely to not meet expectations. They’ve each only won more games than projected once, but those instances are statistical outliers.
What Were the Most Disappointing MLB Seasons Since 1970?
Disappointment is defined by more than if your team wins five fewer games than an algorithm predicted. What other ways can we measure the difference between expectations and outcome? And how can we compare entire seasons?
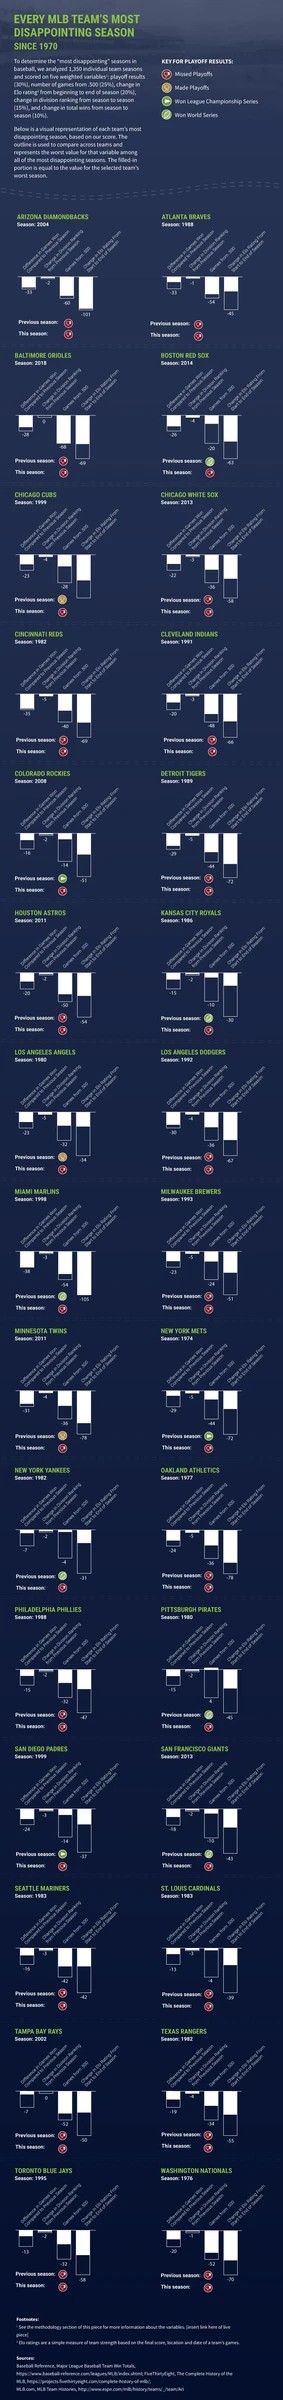
We analyzed every MLB season since 1970, 1,350 individual team seasons. Using five weighted variables, every team’s season received a score from 0 to 100, with 100 being the most disappointing season possible. Our score used the following variables and weights:
30% – Playoff score
Each playoff result is worth the following point total:
Missing the playoffs (0 points)
Making the playoffs via winning the division or winning the wildcard play-in game (1 point)
Winning the Division Series (3 points)
Winning the League Championship Series (6 points)
Winning the World Series (10 points)
The playoff score is the sum of this season’s playoff results and the difference between this and last season’s results, to account for expectations. For example, a team that wins the World Series (10 points) after missing the playoffs the year before (0 points) would have a score of 20 (10 points from this season plus +10 change from year to year).
25% – Number of games from .500
The number of games a team would have to lose or win in a row to have a .500 record.
20% – Change in Elo rating from beginning to end of season
The difference between a team’s FiveThirtyEight Elo rating (a value that measures team strength) at the start of the season and after their final game.
15% – Change in division ranking from season to season
The number of places within their division a team moved from the previous season. For example, a team that placed second this season and fourth last season would have a value of +2, because they moved “up” two spots.
10% – Change in total wins from season to season
The difference between games won this season and games won last season.
Key takeaways from our findings:
The 1998 Miami Marlins have the highest (most disappointing) score: 94 out of 100. While calculating scores, we tested seven different weight distributions of the five variables. The top 10 shifted every time, but the 1998 Marlins always ranked No. 1.
The opposite of “disappointing” here would be “surprising.” The most surprising team since 1970 was the 2013 Boston Red Sox, with a score of 7. They jumped their entire division and won 28 more games than in 2012. That season, they also experienced the largest positive Elo change in our dataset.
The New York Yankees have the lowest average score (46.7) and the Tampa Bay Rays have the highest (58.5).
Among the top 25% of scores (the 338 most disappointing seasons), the five teams that appear the most are:
San Diego Padres (18 times) Pittsburgh Pirates (18) Kansas City Royals (16) Detroit Tigers (16) Baltimore Orioles (15)
The New York Yankees appear in the top 25% of most disappointing seasons the fewest – only four times.
There are 68 seasons that make up the top 5% of most disappointing seasons. The Detroit Tigers appear on that list the most (eight times).
The Philadelphia Phillies, Tampa Bay Rays and Toronto Blue Jays are the only teams not to appear in the top 5% most disappointing seasons.