What is R0 and how should we interpret it? Read this guide to help you understand what R0 means for those who are not epidemiologists.
Data Science Resources
Apr 21, 2020-4 MIN READ
MastersinDataScience.org is owned by 2U, LLC, parent company of edX. Our goal is to help learners make confident, informed decisions about their education and career. Some programs shown here are offered by universities that partner with 2U, for which 2U provides marketing and operational support and receives compensation. Other programs shown may be paid advertisements from third parties. Both types of programs are identified with the word AD or Advertisement. We aim to keep information current and accurate. Learn more about edX and our partners.
R0, pronounced “R-naught,” is the basic reproduction number of infectious agents, or a metric of how contagious something is. Simply put, it is the average number of people every infected person will transmit the virus to. But calculating and interpreting R0 is not so straightforward.
In 2019, experts cautioned against oversimplification of the term. “R0 is affected by numerous biological, sociobehavioral and environmental factors that govern pathogen transmission and, therefore, is usually estimated with various types of complex mathematical models, which make R0 easily misrepresented, misinterpreted and misapplied,” explains Emerging Infectious Diseases, a publication of the Centers for Disease Control and Prevention.
With that in mind, how should we interpret R0? Especially for people who are not epidemiologists?
The R0 value measures the potential spread among a completely susceptible population. “Susceptible” means there is no vaccination, no previous cases of infection that would render people immune and no deliberate intervention to prevent transmission, according to the Australian Department of Health.
If R0 is less than 1, the disease will eventually die out.
If R0 is equal to 1, the disease is maintained at a baseline level or endemic.
If R0 is more than 1, the disease will spread exponentially and can become an epidemic or pandemic.
The effective difference in cases between seemingly similar R0s can be extreme. The median R for the 1918 influenza pandemic was 1.8. If one person infects 1.8 people, and those new cases infect another 1.8, the number of cases stemming from a single individual grows rapidly. Through 10 rounds of infections, there could be 357 cases.
However, a virus with an R0 twice as large causes vastly more than twice as many cases. In this example, 10 rounds of infection where R0 equals 3.6 would result in 365,615 cases.
That’s why viruses such as the measles are heavily monitored; R0 estimates for the measles range from 12 to 18, according to a systematic review of measles modeling.
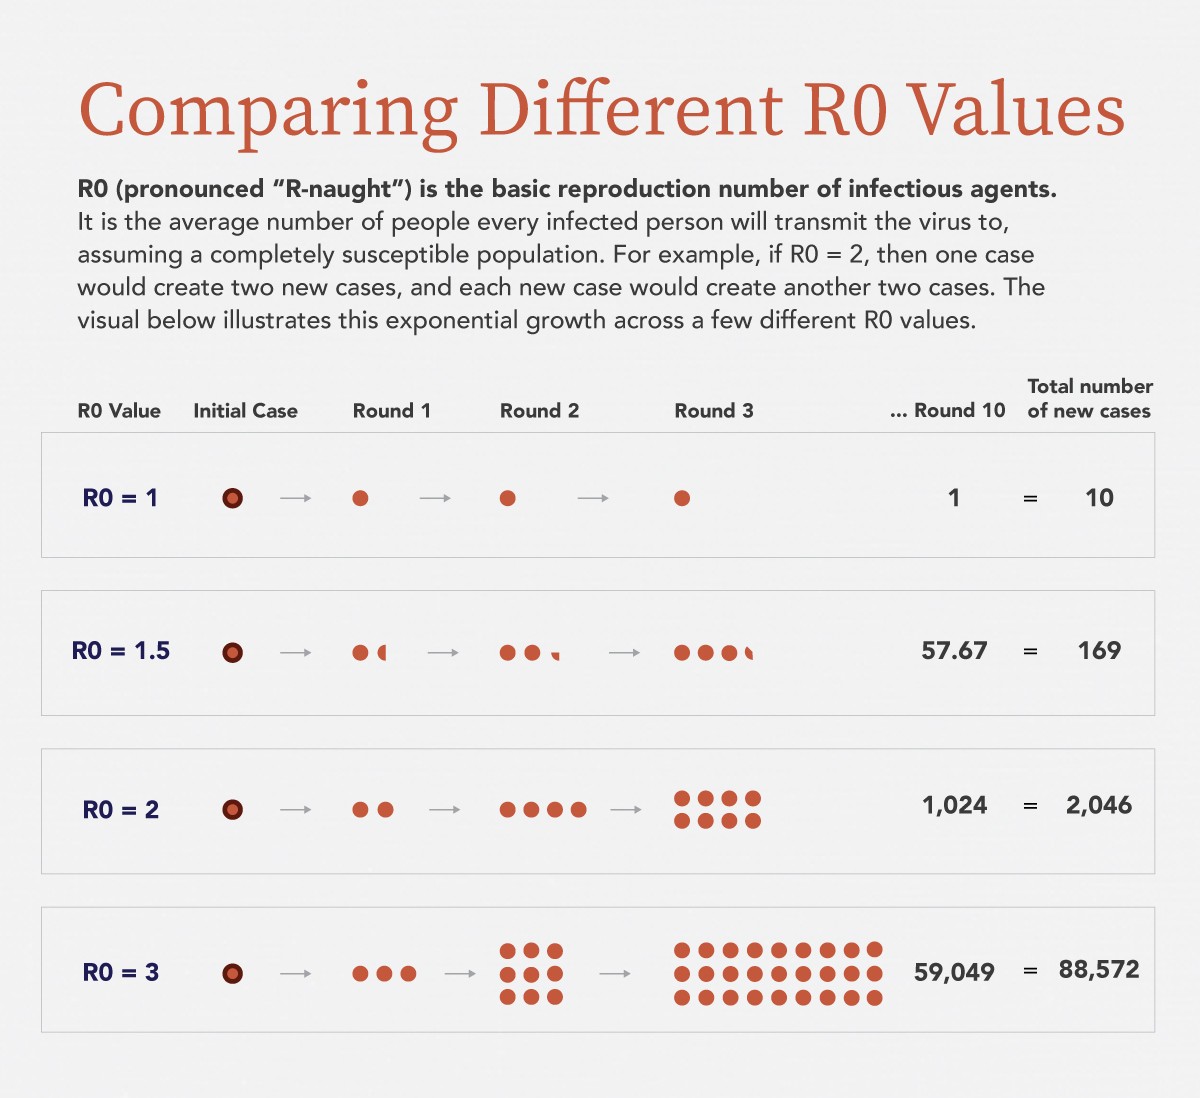
R0 is the average number of people every infected person will transmit a virus to, assuming a completely susceptible population. As R0 increases, the number of infections grows exponentially. For example, if R0 equals 1.5, 10 rounds of infection would create almost 170 additional cases. If R0 equals 2, 10 rounds of infection would create 2,046 additional cases.
R0 is calculated using three primary variables (PDF, 239 KB): the infectious period, the contact rate and the likelihood of infection per contact. Environmental factors can also be considered, like the availability of health resources and the built environment.
R0 can still change—there is no constant value for a specific disease. Delamater et al. writes “Even if the infectiousness of a pathogen … and the duration of contagiousness are biological constants, R0 will fluctuate if the rate of human–human or human–vector interactions varies over time or space.”
At any given time there is usually a range of estimated R0s, depending on the mathematical model used and the location.
How is R0 different from R and RT?
Remember, R0 is the basic reproduction number—an estimate of the potential spread under specific conditions. But what if there is some immunity or a vaccine?
When a population has immunity because of past infection or implements interventions, we can use R, the effective reproduction number, to describe the spread.
Like R0, R can vary as immunity levels or measures to prevent spread differ from place to place. The goal here is still to reach an R value below 1 so the disease spreads more slowly.
There’s also R(t), the reproduction number at a given time. This can be used to trace changes in R throughout the history of a virus, according to Complexity of the Basic Reproduction Number (R0).
Which one should you pay attention to? You’ll likely hear or read about some combination of all of these metrics. The important thing is to understand the differences as best you can, and to remember the likelihood of variance across different estimates.
Much still remains unknown about the properties of this virus, like the infectious period, which makes calculating an accurate R0 tough.
Joseph Eisenberg, professor and chair of epidemiology at the University of Michigan, described a few of the other difficulties in February. “Researchers don’t know how many mild cases or infections that don’t result in symptoms have been missed by surveillance but nevertheless are spreading the disease,” he wrote. “And likely the most important reason, no one knows the future impacts of current disease control measures.”
So, how do we lower R values below 1?
Remember, R0 will not take into effect measures like social distancing, which impacts the contact rate in the calculation. But, it does show us the potential for spread if we do nothing.
To bring down the effective reproduction number R, people need to engage in practices like social distancing and avoiding travel. Try some of the following resources to learn more about the response to COVID-19, flattening the curve and the spread of the virus over time.
Find out what to do if you are sick and how many cases are in the United States on the CDC coronavirus homepage.